The Colombian Data Atlas
Portfolio | Links:
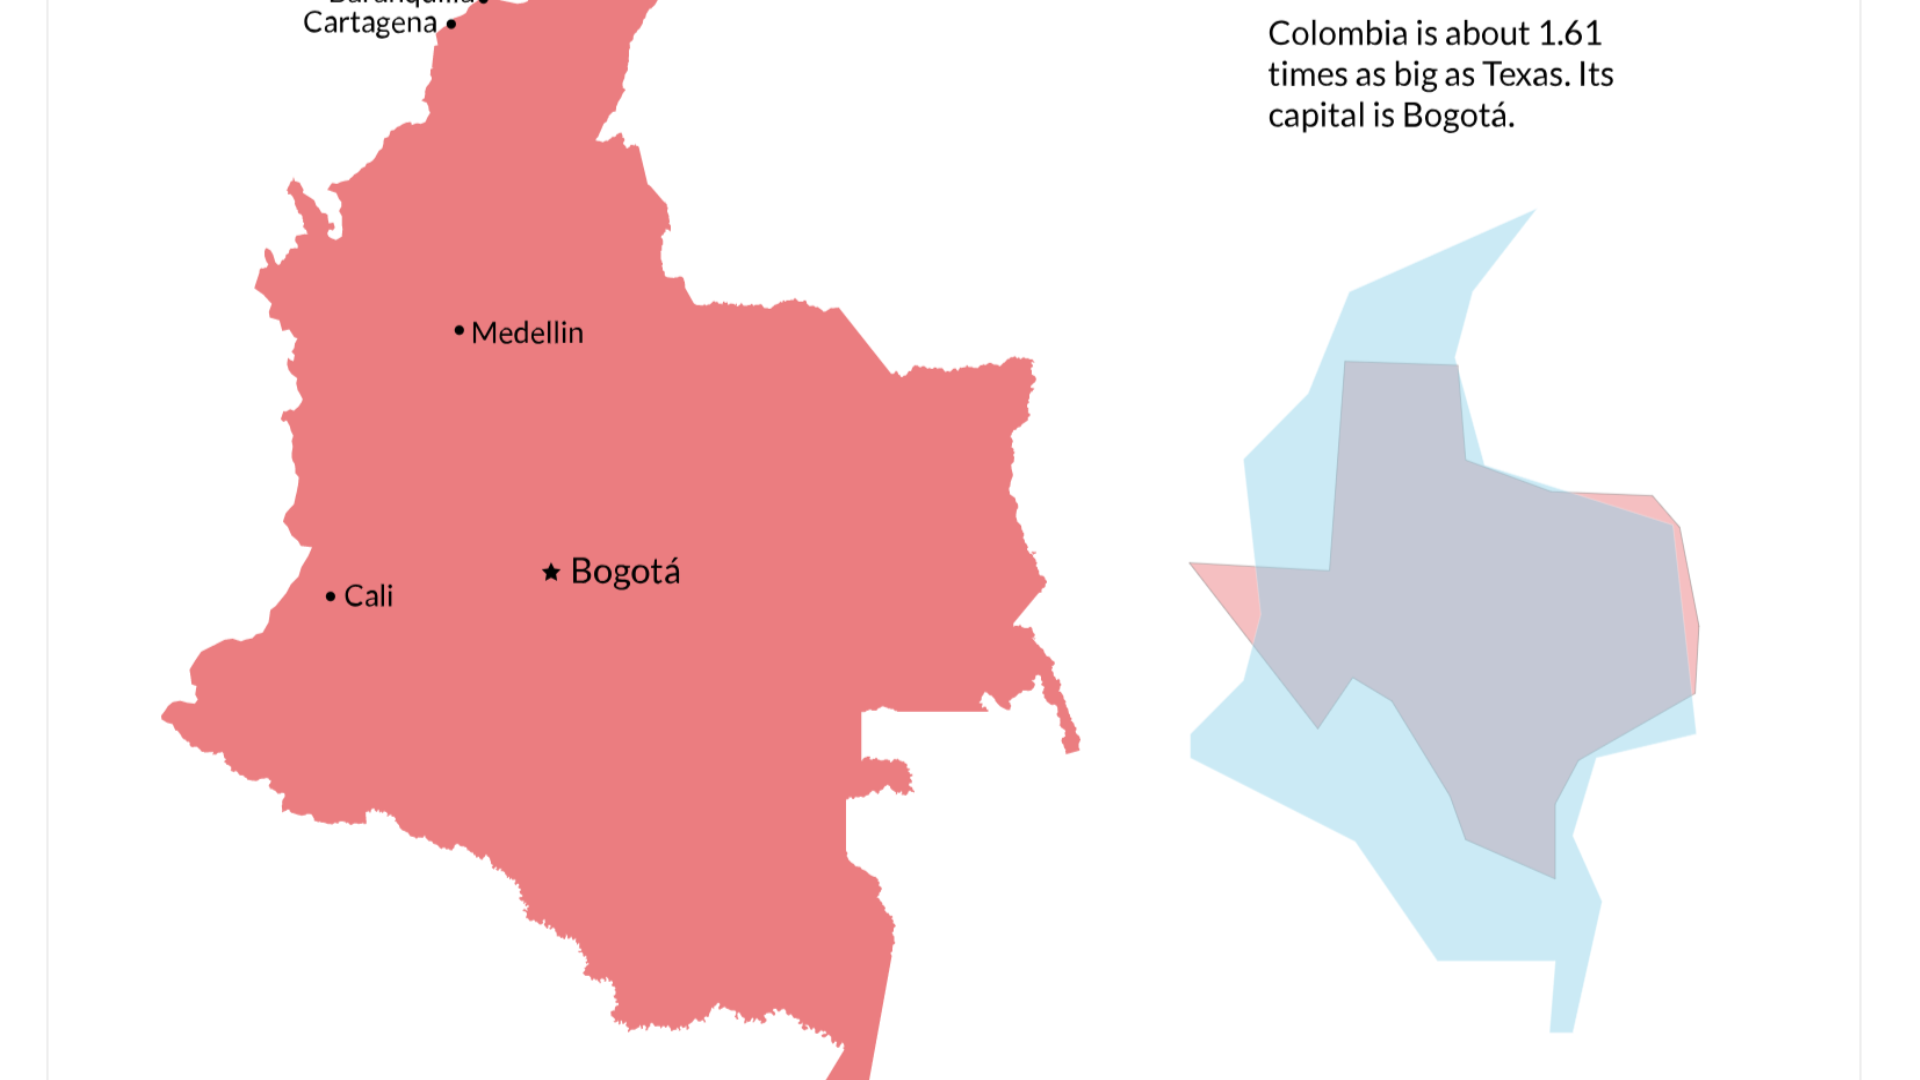
This was the last assignment for my introductory static visualization course. We were tasked with creating a series of infographics about a country. I was assigned Colombia. I tried to include interesting captions that provided information not inherent in the visuals. I also opted for a simple design, and ordered each illustration according to a narrative format. I began with geography and climate, then shifted to demographics, economy, and finally communications.
We were also required to visualize a topic of our choosing. I picked Colombia’s drug trade, since it is a large and controversial component of the country’s economy, and also very relevant to issues facing the United States.
Overall, this project was quite challenging, and helped me develop my visualization and data gathering skills.


